The Teardown Stage 1 Vancouver West Oct 2025

Blog Post Image
Real Estate


OCTOBER 2025

Deconstructing Real Estate Insights

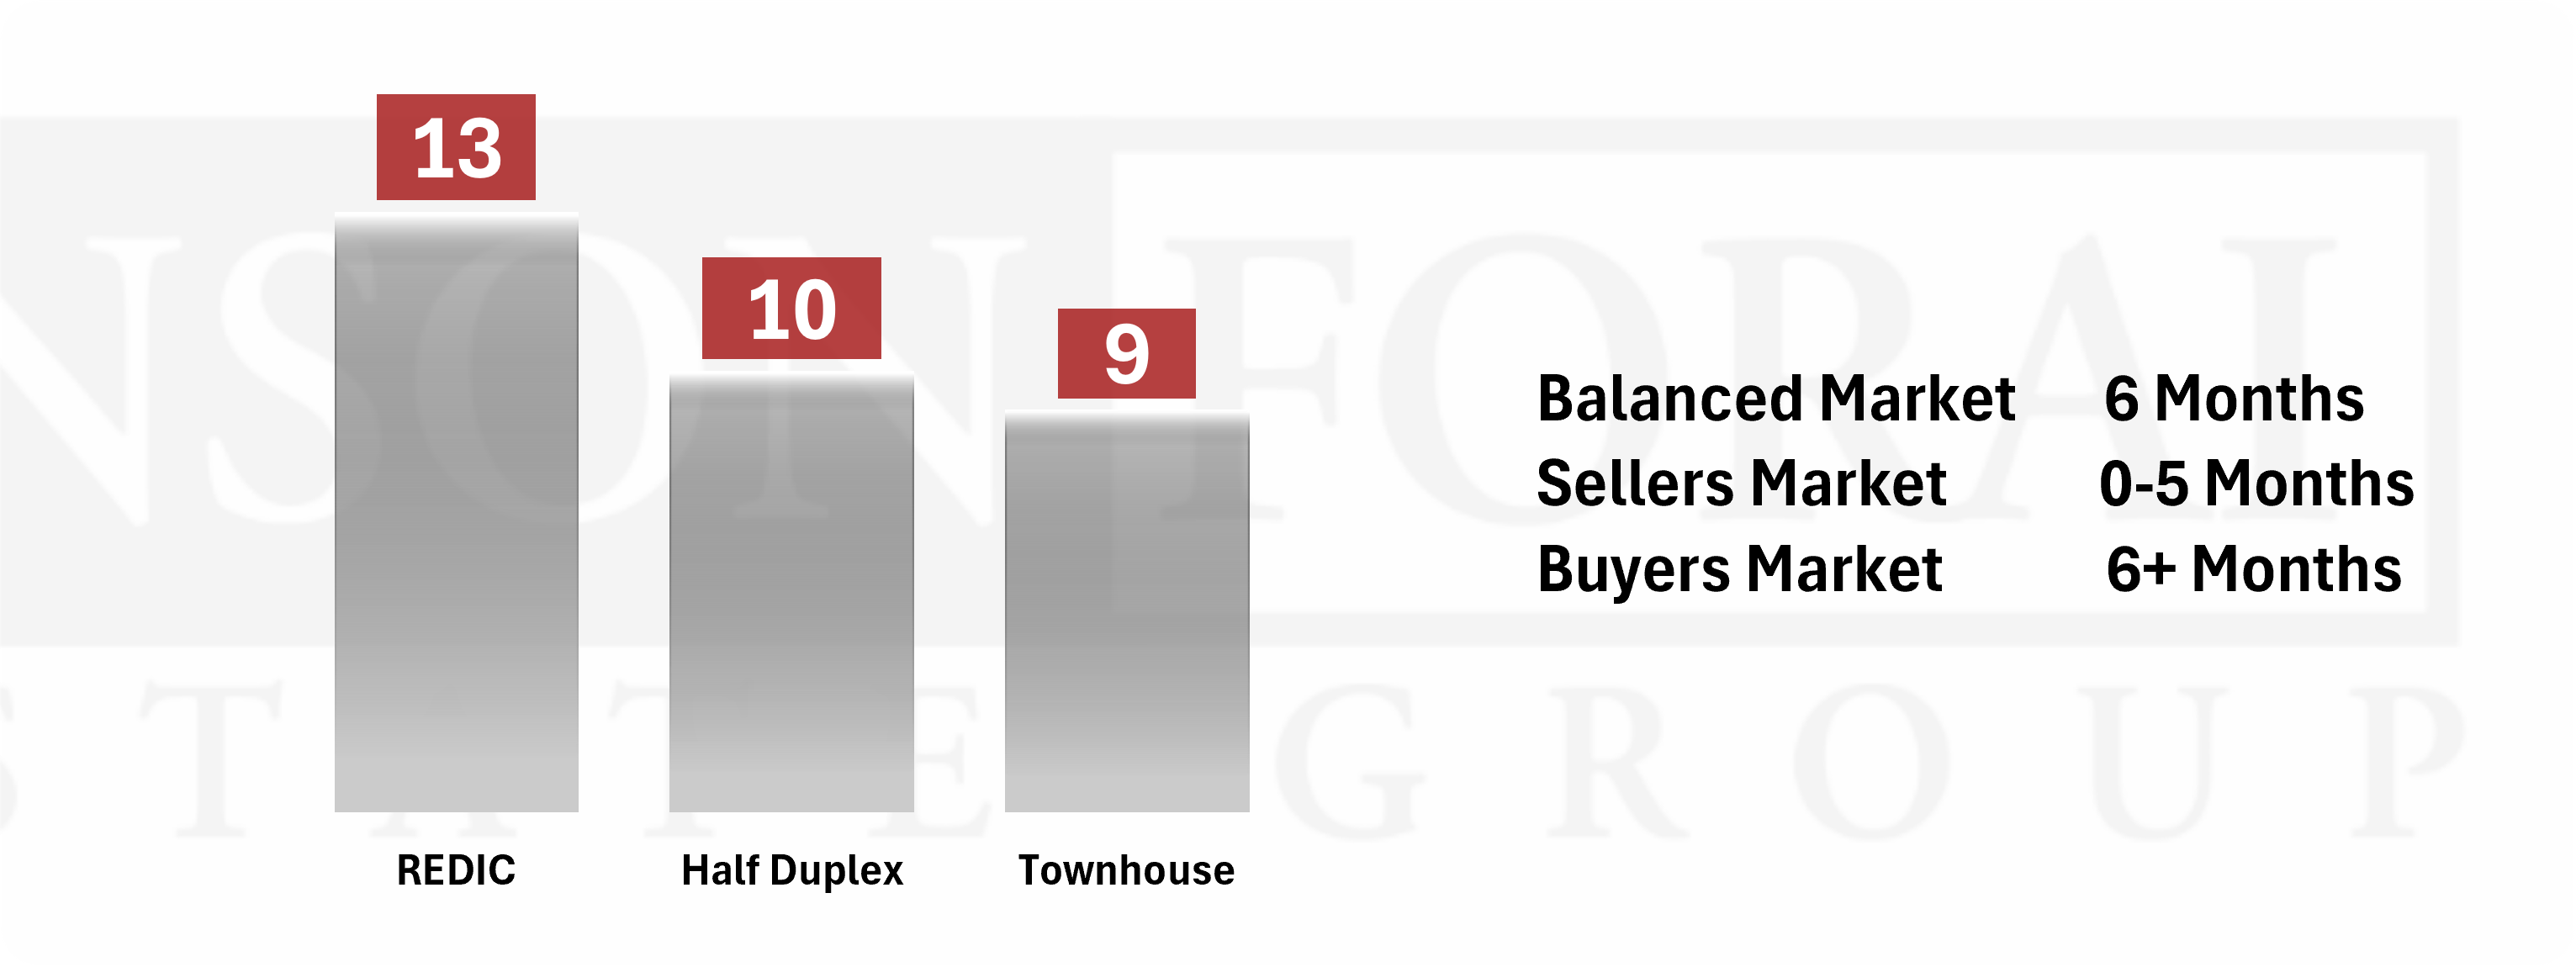
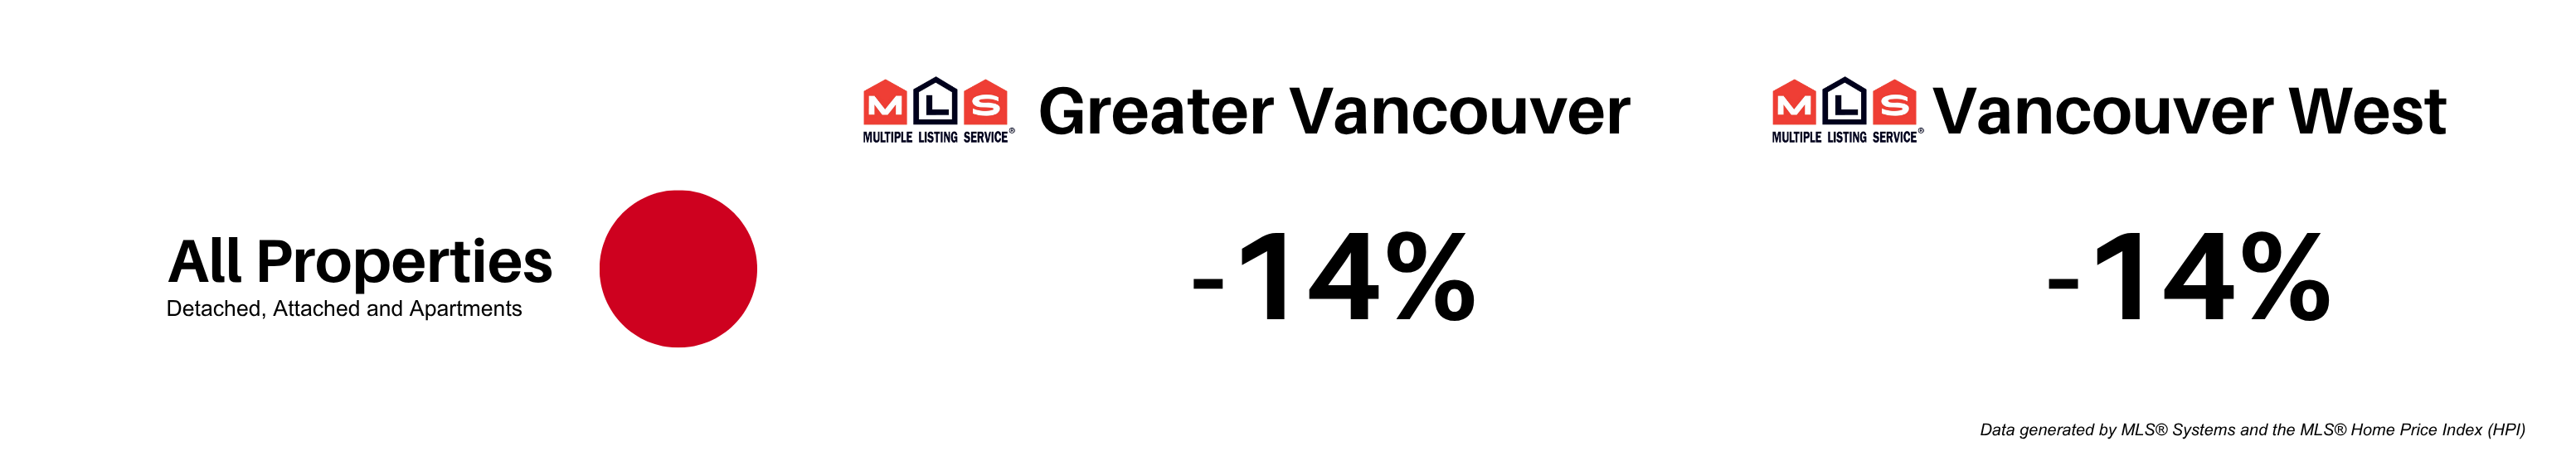
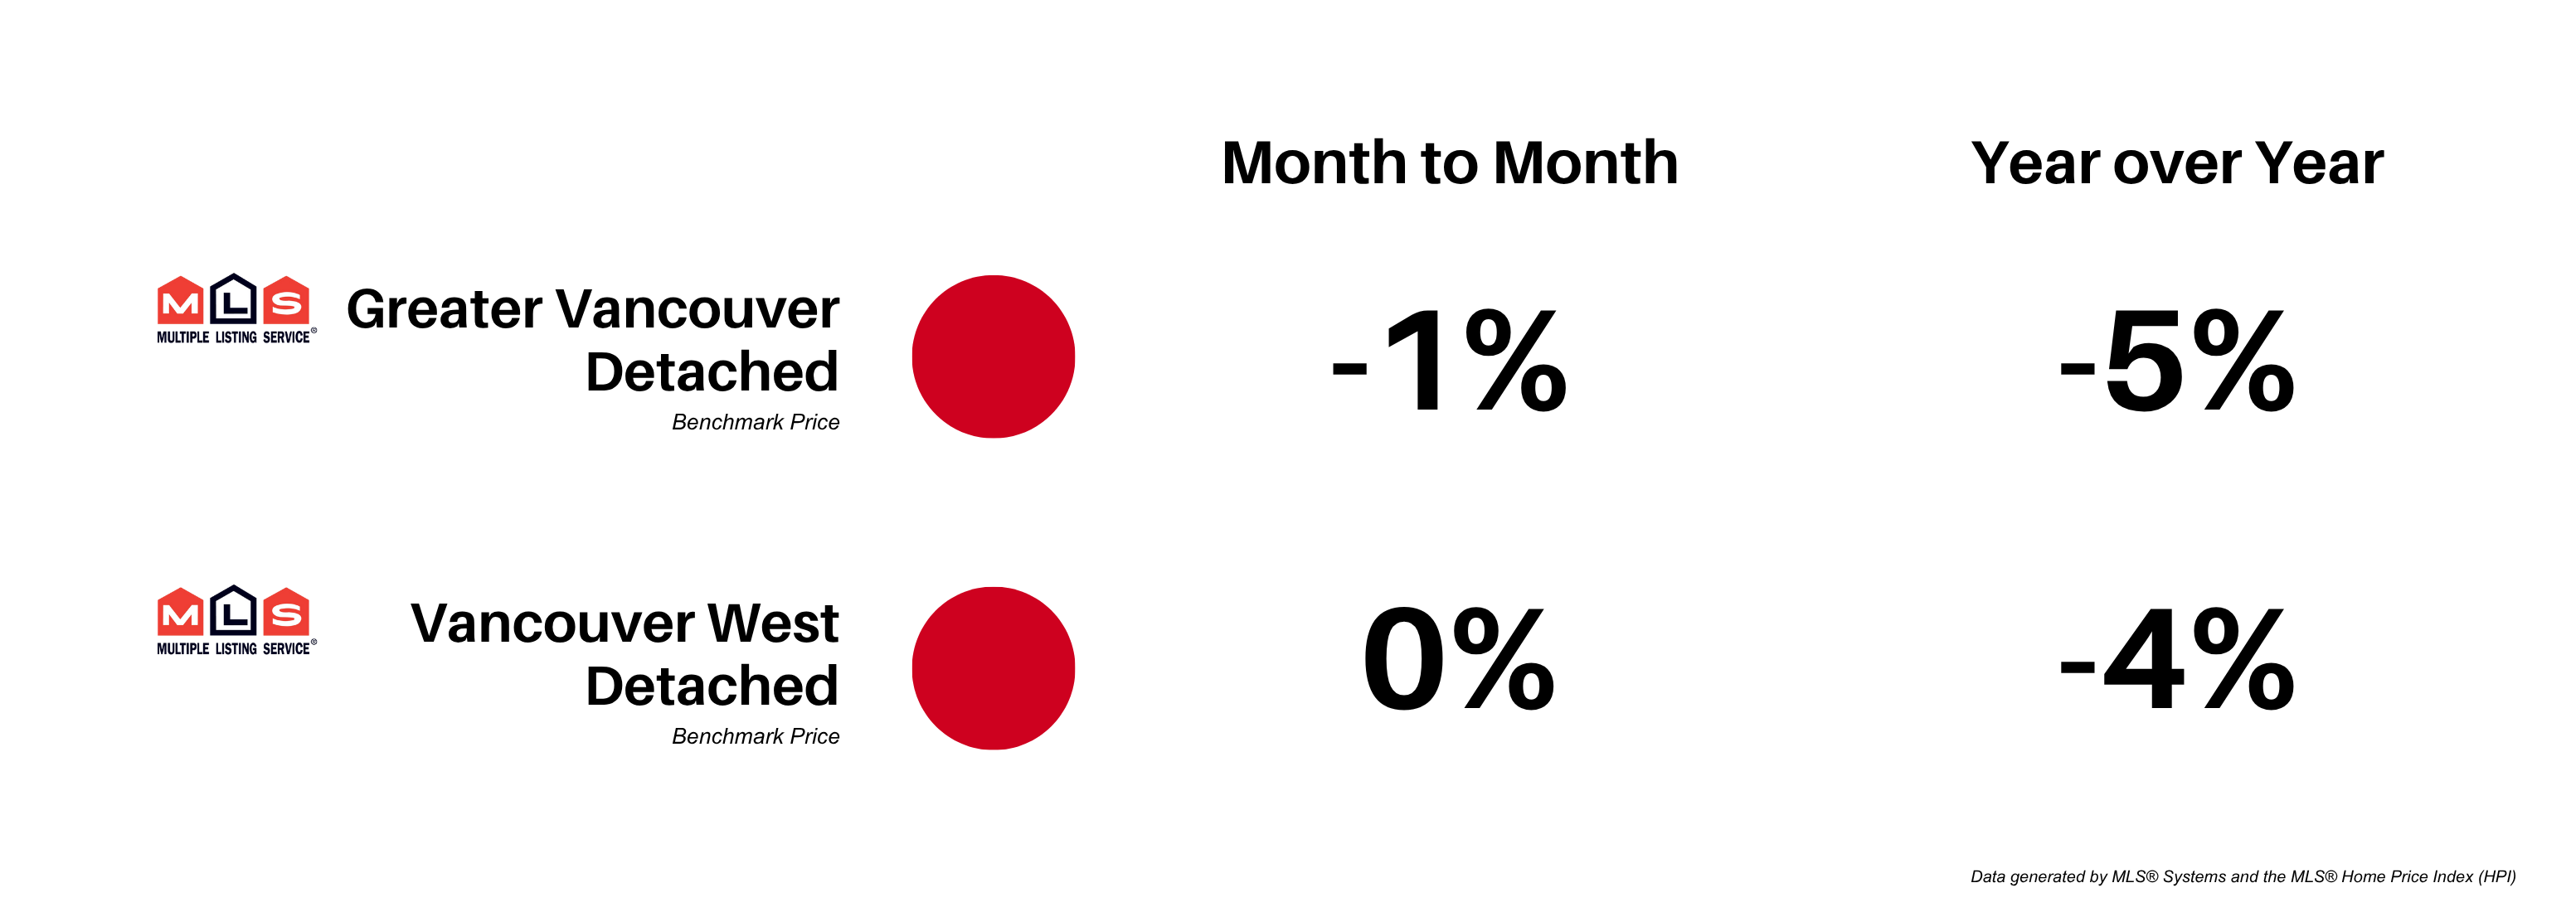
"Board Stats: -5% | Developer/Investor Reality: -12%"


That 7-point gap represents millions in mispriced land deals this month.


Standard MLS benchmarks told you the Vancouver West detached market was "softening moderately." Our October data shows REDIC or "Land Value Properties" declined 12% from last month —a decline more than twice what general stats reported.


Why the difference? Monthly Board released statistics:


Blend 50-60% current data with months-old transactions


Use homeowner-focused benchmarks that exclude new

construction and land value properties


Report what already happened, not what's happening now


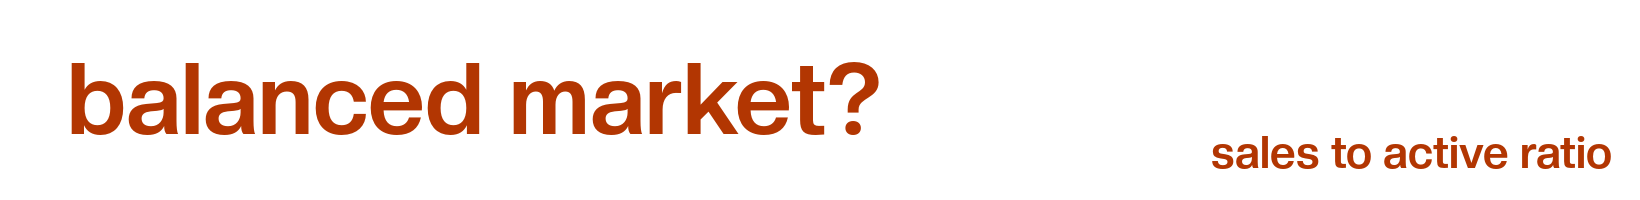
The Teardown tracks development-specific metrics in real time:


REDIC - land value properties (acquisition opportunities)


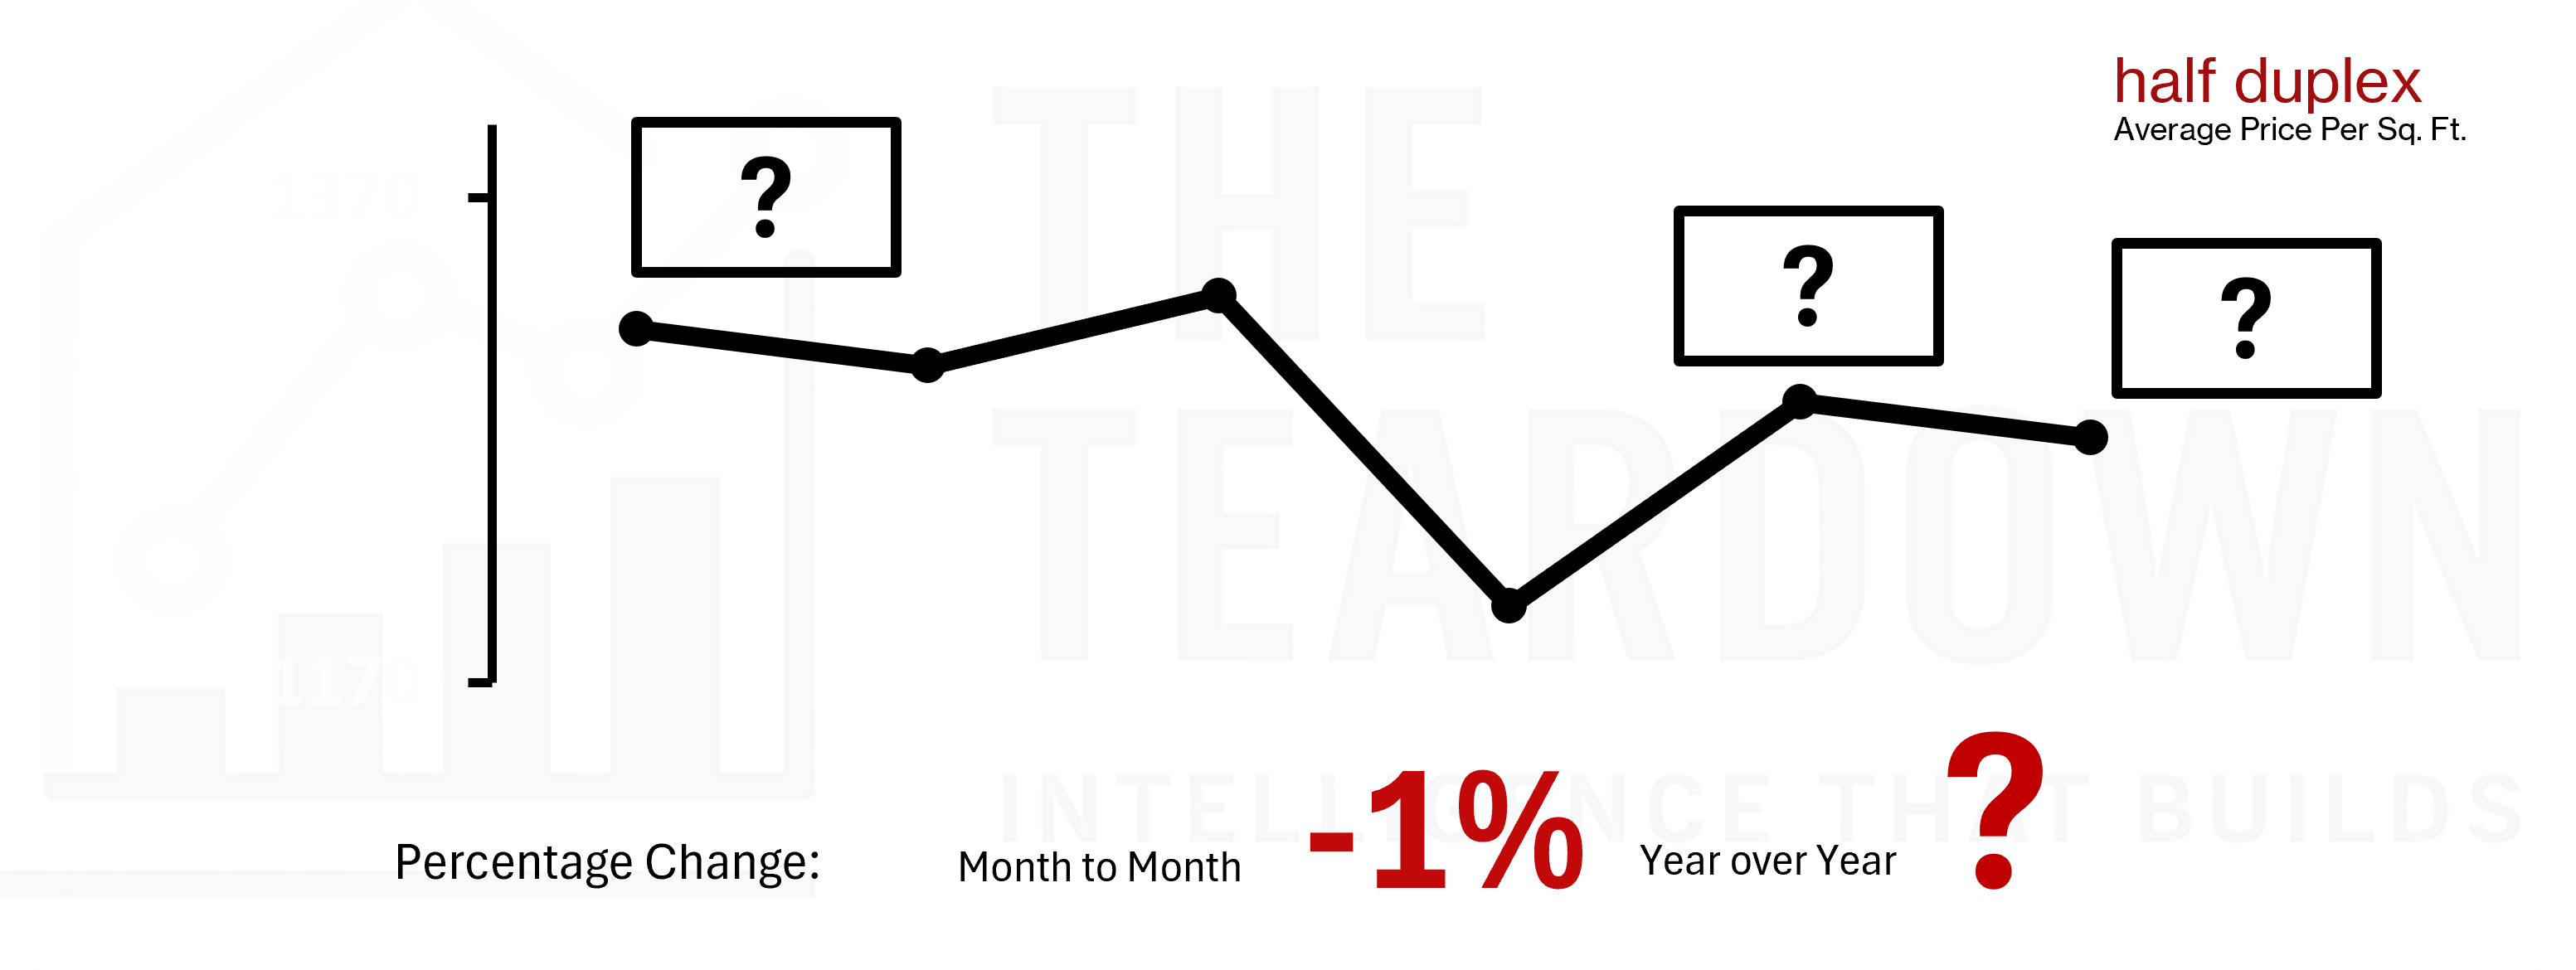
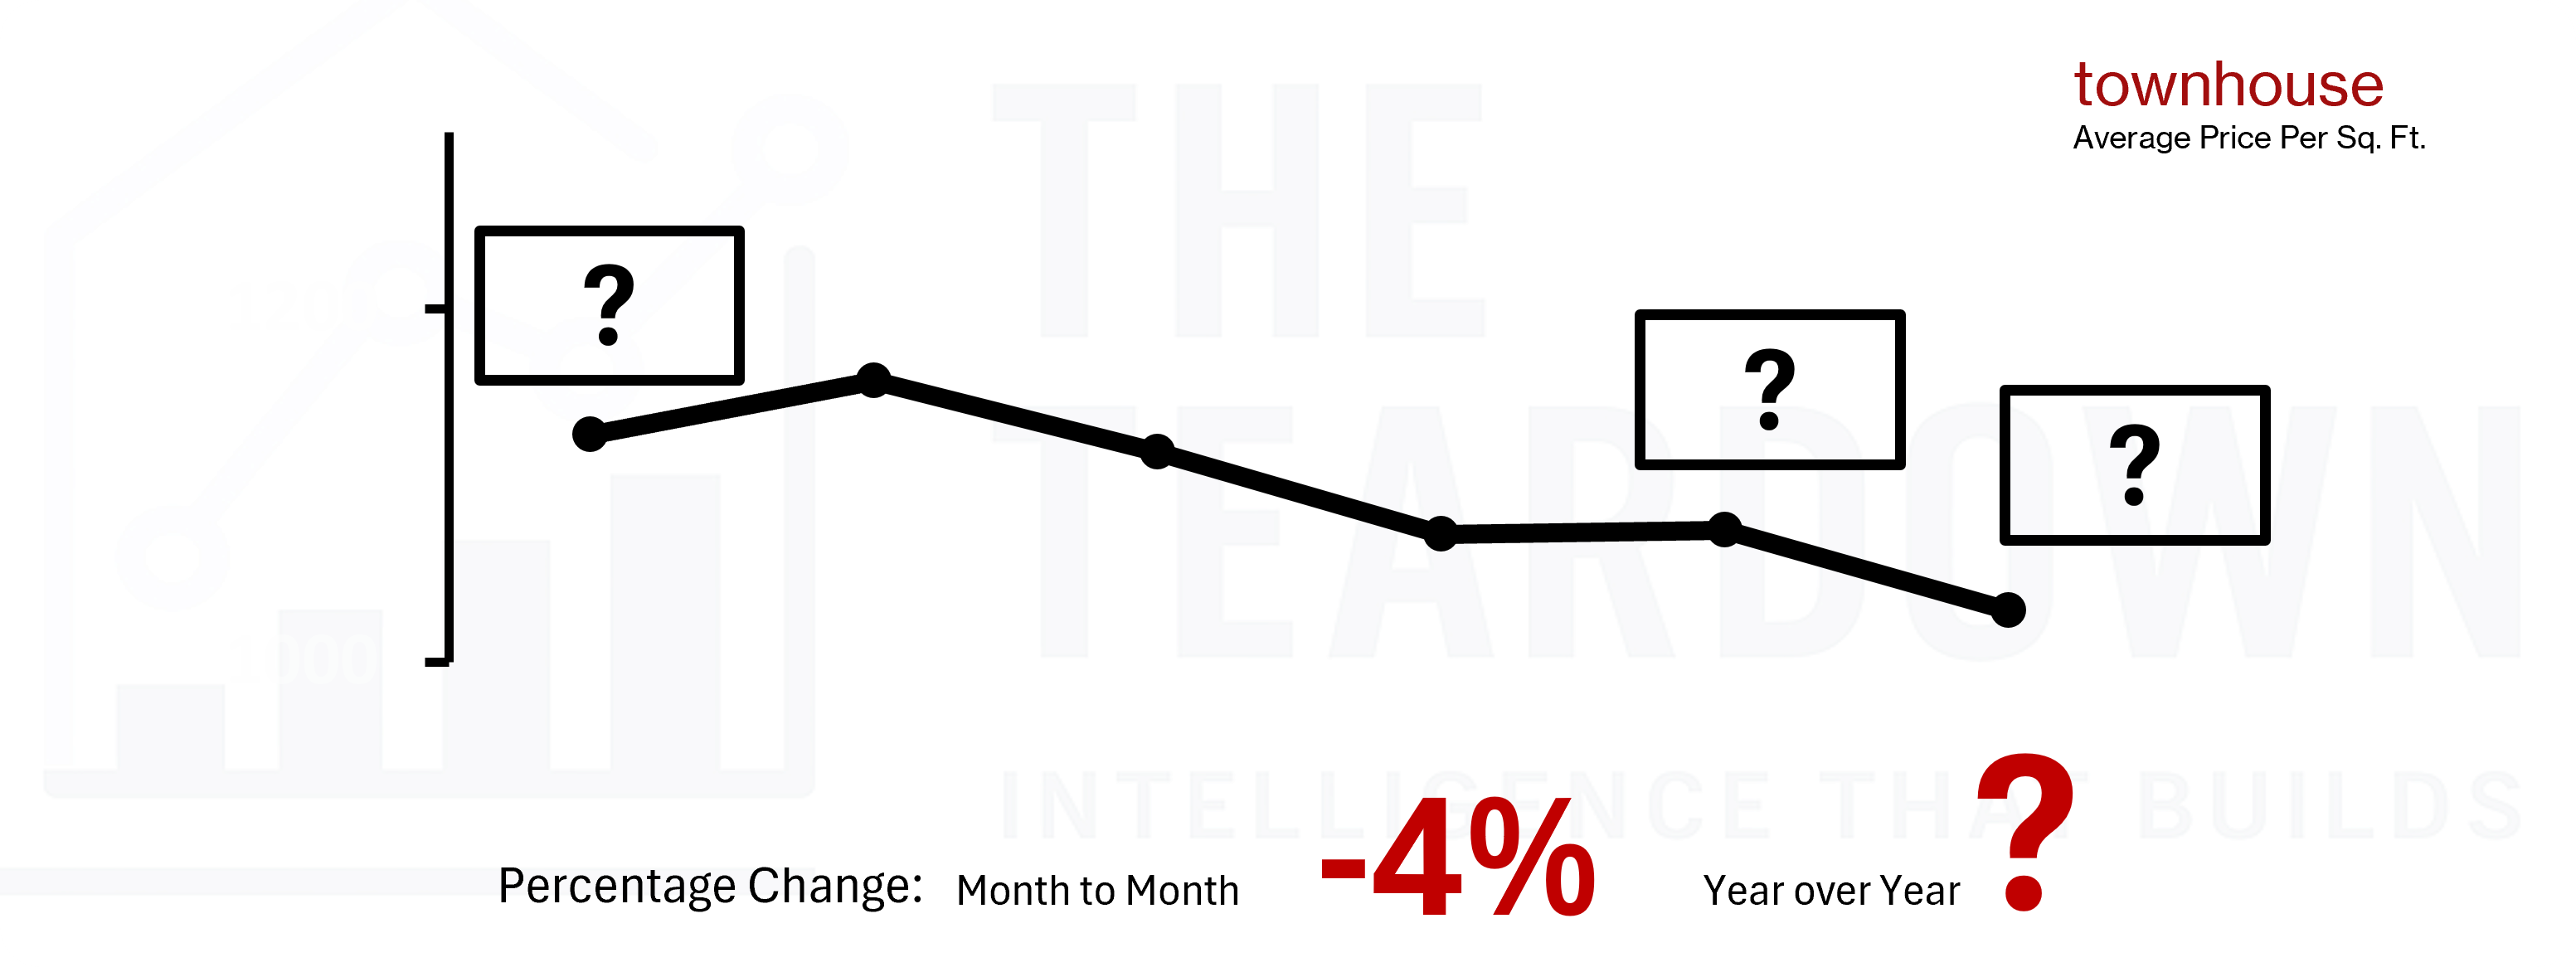
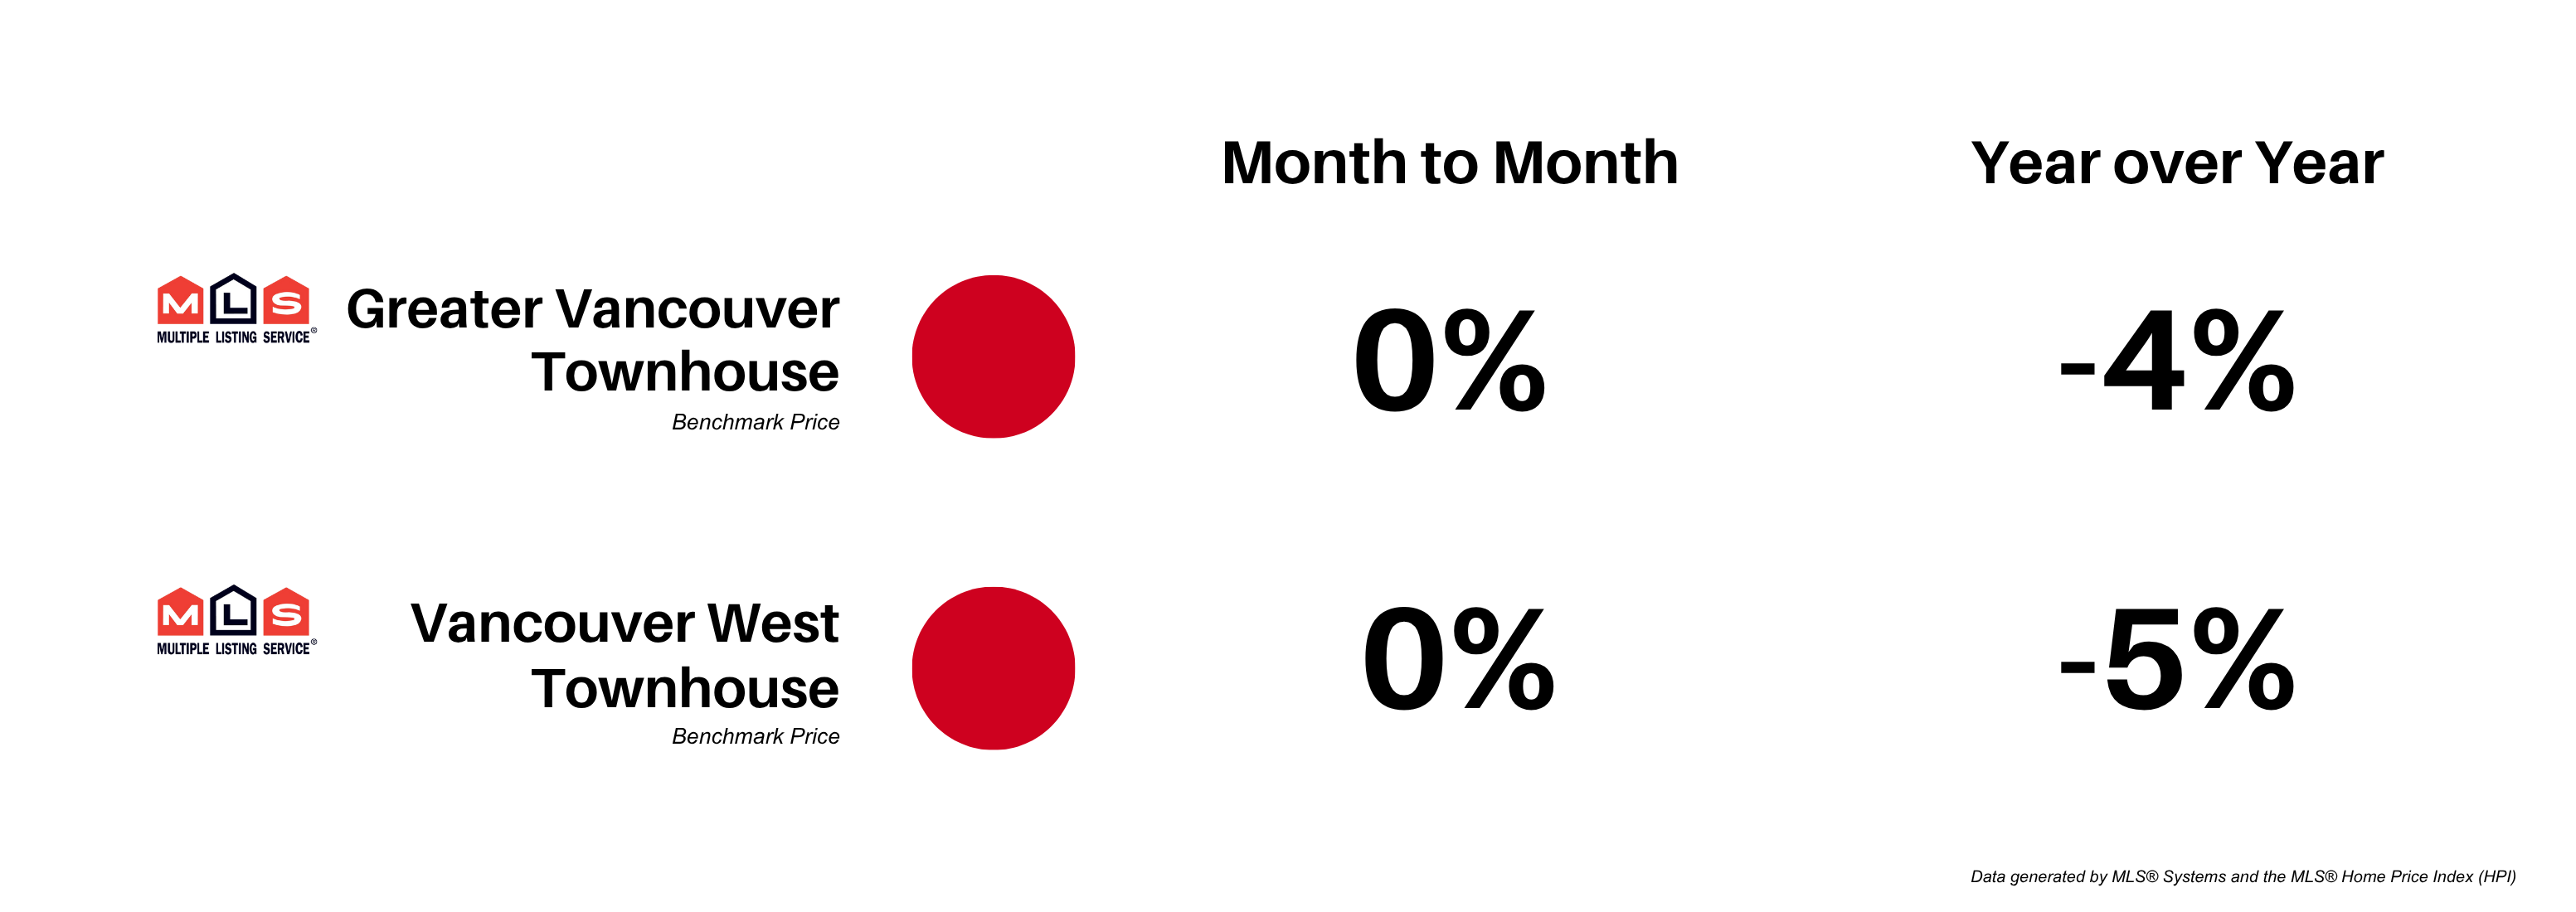
Townhouse and Half Duplex trends (your exit market)


That's exactly what The Teardown delivers.


In this market analysis, we've engineered custom visualizations and trend indicators that cut through the noise of blanket market stats. While the Real Estate Board reports tell every agent the same story, our graphs reveal the specific patterns that separate profitable development deals from capital traps. We track development specific metrics/analytics, that simply don't exist in standard market reports.


Whether you're a builder sourcing your next project, an investor maximizing ROI, or a developer preparing an exit strategy, the insights below will give you the competitive edge that comes from seeing what others miss.


Let's tear it down.

"The Vancouver West development market for small to medium builders shows a 10% sales-to-active ratio (buyers' market), slightly softer than both Greater Vancouver and Vancouver West overall, which are balanced at 14% and 13% respectively.."

"Inventory levels vary by property type in the development market, with REDIC properties at 13 months, half duplexes at 10 months, and townhouses at 9 months; comparable data for Greater Vancouver and Vancouver West overall is not available in the general statistics package."


. . . . and this is how the Board of Greater Vancouver Realtors reports👇👇👇

"Both Greater Vancouver and Vancouver West saw sold units decline 14% year-over-year, while the development market showed a smaller 7% decrease, indicating relative resilience in the small to medium builder segment."


. . . . and this is how the Board of Greater Vancouver Realtors reports👇👇👇

"Greater Vancouver listings remained flat while Vancouver West declined 7%, yet the development market saw a 4% increase in listings, revealing inventory dynamics that developers need to monitor but that don't surface in benchmark-based board reporting."

"


. . . . and this is how the Board of Greater Vancouver Realtors reports👇👇👇

"Month-to-month prices dipped 1% in the development market, a real-time trend that board statistics simply cannot capture for this property type, leaving builders without crucial pricing intelligence." Year-over-year trends reveal even more dramatic movements—unlock the full picture with Stage 2 access.


. . . . and this is how the Board of Greater Vancouver Realtors reports👇👇👇

The development market saw a 4% month-to-month decline, closely tracking Vancouver West's 5% annual decline but revealing monthly volatility that benchmark pricing averages out—critical timing information for builders and investors. Curious how this compares year-over-year? Stage 2 subscribers see the complete trend data.


. . . . and this is how the Board of Greater Vancouver Realtors reports👇👇👇

REDIC properties experienced a significant 12% month-to-month price decline in the development market, a stark contrast to the modest benchmark price declines shown in Greater Vancouver board stats—highlighting how land-value properties move independently from the established home market that benchmark pricing is designed to track. The year-over-year comparison tells an even more compelling story about acquisition timing—available exclusively in Stage 2.

🔒 UNLOCK MARKET-SPECIFIC INTELLIGENCE


Stage 2 subscribers get Vancouver WEST or EAST-specific


✅ Units listed and Sold Year over Year Trends


✅ Sold Price Trends 


✅ Sales to Active Ratios - Months of Inventory


✅ For Developers, Investors and Land Value property owners


💰 PRICING: $149/month ($1,788/year)


But here's the deal:


- List or Purchase 1 property with us → Get $1,788 back


- Effective cost: $0


- You're essentially getting paid $1,788 to access premium market intel

start risk free

Summary: REDIC Acquisition Market

Vancouver West's REDIC development market offers compelling acquisition opportunities with prices down 12% month-to-month—a trend invisible in board statistics that capture only 50-60% of monthly activity through benchmark pricing and processed dates. With 13 months of inventory and a 10% sales-to-active ratio in solid buyers' market territory, developers gain stronger negotiating power and broader site selection at softening prices.

Summary: Townhouse/Duplex Exit Market & Developer Opportunity

While REDIC costs fell 12% month-to-month, exit markets show resilience: townhouses down 4% monthly, half duplexes down just 1% monthly. This widening spread between declining input costs and stable output pricing expands profit margins—the acquisition side softens faster than sales, improving project returns. With 9-10 months inventory for townhouses/duplexes versus 13 for REDIC sites, built product absorbs faster than land, validating the buy-low-build-sell-high strategy. Board statistics miss this arbitrage entirely, excluding new construction from benchmarks and overlooking real-time dynamics critical for development timing.


Click below for our updated daily list of Featured REDIC Properties!

 
If you have a brokerage relationship with another agency, this material is not intended as a solicitation. Information is reliable but not guaranteed and should not be considered legal or financial advice. Each Keller Williams office is independently owned and operated. Copyright (C) 2024 Keller Williams (R) Realty, Inc.